 CoTester 2.0 is LIVE! Your Always-Available AI Teammate for Testing.
Releasing a well-tested app is just half the work. You also need to monitor how your apps are performing when real users start interacting with them. Delays in critical functions like login, checkout, or API calls can create poor user experiences. This is why continuous application monitoring post-deployment is essential.
A study shows that teams with full-stack observability report fewer IT outages and detect them 7 minutes faster than those without it.
Therefore, in this blog, we have listed the top six application performance monitoring tools that will help you detect performance issues efficiently.
Assess your app’s performance under real-world conditions with TestGrid. Request a free trial.

APM Tools Overview
TL;DR
- TestGrid: Performance testing platform for web, mobile, and API apps and support for tracking critical performance metrics
- New Relic: Full-stack APM platform for monitoring app performance, errors, dependencies, and distributed transactions
- Dynatrace: AI-powered platform for application monitoring, dependency mapping, and automated root-cause analysis
- Datadog: Cloud-based tool for distributed tracing, service monitoring, and code-level performance insights
- Splunk AppDynamics: Enterprise-grade platform for monitoring app performance, transactions, dependencies, and business impact
- Elastic APM: OpenTelemetry-based APM solution for distributed tracing, dependency monitoring, and application performance analysis
What are APM Tools?
Application performance monitoring, or APM tools are software systems that monitor an app’s performance, availability, and behavior by collecting telemetry such as metrics, traces, and logs. They can help you track response times, errors, transactions, and dependencies so you can identify performance bottlenecks early, understand their causes, and troubleshoot them.
How We Evaluated These APM Tools
Now you know what an APM tool is; let’s find out which are the best ones in this space.
When we assessed application performance tools, we focused on the most critical factors: monitoring coverage, performance analysis, application architecture visibility, performance metrics, and alerting.
We first considered the metrics the tools allowed users to measure, such as response time, throughput, error rate, request rate, and Apdex. Then we examined transaction and distributed tracing to understand how effectively you can track requests across services.
Next, we searched for features like data correlation, baselines, anomaly detection, data retention, alerting, and root cause analysis for faster issue identification and resolution. And finally, we researched monitoring capabilities, including infrastructure, user experience, network, synthetic, and real user monitoring (RUM).
After thorough evaluation of all these factors, we handpicked the best six application monitoring tools.
Application Performance Monitoring Tools Comparison
The table below shows how the APM tools differ in their capabilities, tech compatibility, hosting options, and pricing models. You can refer to it to identify which tools align with your test goals.
| Tool Name | Best For | Tech Stack Compatibility | Hosting Options | Pricing Model |
|---|---|---|---|---|
| TestGrid | Performance testing of web and mobile apps on real devices | Appium, Cypress, Playwright, Espresso, XCUITest, WebdriverIO, Detox, Java, JavaScript, TypeScript, Python, C#, Ruby, and Kotlin | Dedicated hosting, private cloud, on-premises, hybrid | Paid; free trial available |
| New Relic | Full-stack application monitoring | Go, Java, .NET, Node.js, PHP, Django, Flask, CherryPy, Falcon, GraphQL | SaaS / cloud-hosted | Paid; free tier available |
| Dynatrace | Large-scale enterprise systems | Java, .NET, Go, Node.js, Python, Apache Tomcat, Django, Flask, FastAPI, Falcon, Sanic | SaaS, managed/on-premises, hybrid | As per usage |
| Datadog | Microservices and cloud workloads | Java, Python, Ruby, Go, Node.js, .NET, PHP, Grizzly, GraphQL, Hibernate, Spring Data | SaaS / cloud-hosted | Paid |
| Splunk AppDynamics | Transaction-heavy business apps | Java, .NET, Node.js, PHP, Python, C/C++, Akka, Ktor, Play | SaaS, on-premises | Paid |
| Elastic APM | Distributed microservices environments | Go, Java, .NET, Node.js, PHP, Python, Ruby, Django, Flask, Aiohttp, Tornado | Cloud, on-premises | As per usage |
Also Read: Best 20 Performance Testing Tools in 2026
Best 6 APM Tools in 2026
1. TestGrid
Best For: QA teams combining performance testing with broader software testing workflows

TestGrid is an AI-native end-to-end software testing platform that helps you run performance tests for your apps, evaluate actionable performance metrics, and ensure stability under real-world traffic conditions.
You can connect with CI/CD tools like Jenkins, Azure DevOps, or GitHub Actions to run automated performance tests and continuously monitor performance to maintain consistent responsiveness after each update.
Features
- Assess your app’s performance across native, hybrid, and web apps on 1000+ real Android and iOS devices
- Monitor CPU, memory, battery, network activity, responsiveness, and transaction response times to assess your app’s performance
- Analyze individual transactions and compare current build performance with previous results to identify performance changes
- Review execution logs, step-level results, page-performance data, and transaction-level metrics to inspect issues
- Prevent errors in each release and lower your mean-time-to-resolution (MTTR)
Limitations
- Teams may need some time for initial setup and configuration; however, detailed documentation and support are always available
Pricing
- CoTester Starter Package: Starts at $199 per seat/month (minimum 4 seats; includes 4 devices/browsers and 5,000 tokens)
- CoTester Growth Package: Custom pricing (includes all Starter features + marketplace integrations)
- Enterprise Test Infra (On-Prem / Hosted): Custom pricing (dedicated test lab for segregated enterprise teams)
2. New Relic
Best For: Full-stack application performance monitoring across the development lifecycle
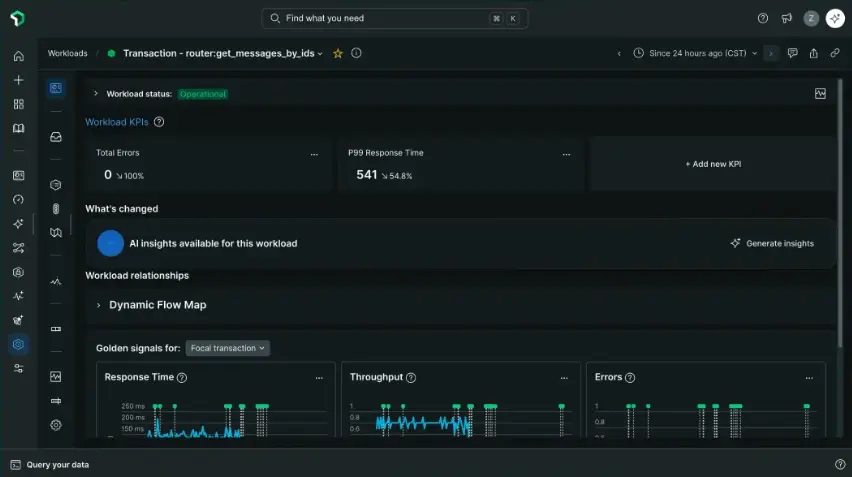
New Relic is one of the top tools when it comes to application performance monitoring. It gives you end-to-end visibility for all your apps and helps you track critical metrics like response times, resource usage, and error rates. It comes with automatic APM agents and OpenTelemetry support for instrumenting apps and collecting performance data.
Features
- Get at-a-glance health insights at every development stage
- See code-level insights from browser to infrastructure, and spot the root cause easily
- Detect and monitor app performance insights for Kubernetes workloads automatically
- Monitor the golden metrics instantly, visualize dependencies, and find issues with alerts and error tracking
Limitations
- Some users report slight lags when they want to open a particular log
- Alerts can get overwhelming if not tuned well
- The interface is feature-rich but may feel complex
Pricing
- Free (100GB/month data ingest)
- Standard: Custom
- Pro: Custom
- Enterprise: Custom
3. Dynatrace
Best For: Large hybrid and multicloud apps that need automated monitoring and root cause analysis
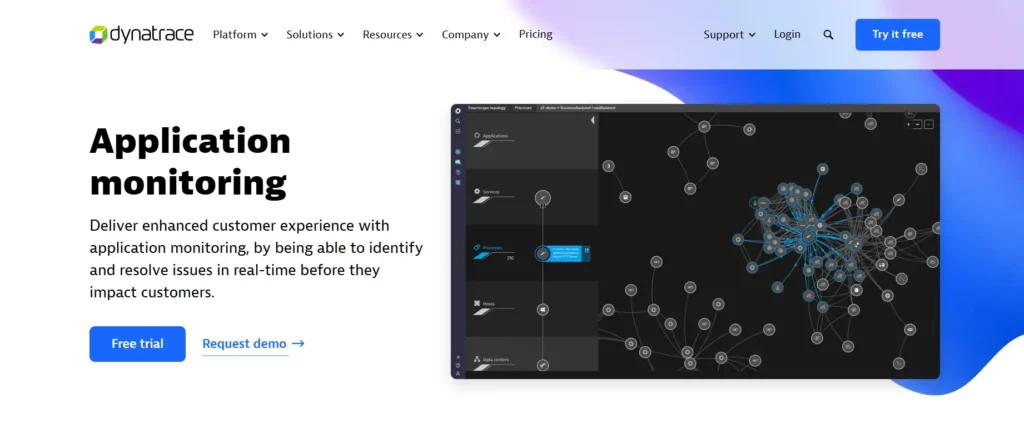
Dynatrace offers full-stack application monitoring including your frontend, backend, infrastructure, and cloud, so you can stay on top of all performance issues across all layers. One of the best things about Dynatrace is that it keeps track of every single user journey end to end. Plus, you receive notifications that tell you the root cause of the problems.
Features
- Auto-detect all app dependencies and track transactions across all tiers
- Resolve performance or availability issues before they impact your users with AI
- Monitor applications down to the code level and track metrics in real-time
- Proactively spot anomalies and get full insights into response times, threading, and database calls
Limitations
- Issue investigation may require navigating through multiple screens
- May involve a high learning curve because of a large number of features
- Users report cost transparency can make the experience better
Pricing
- Plans available based on testing needs
Learn More: AI Performance Testing: Types, Techniques, and Best Practices
4. Datadog
Best For: Cloud-scale apps requiring unified APM and observability
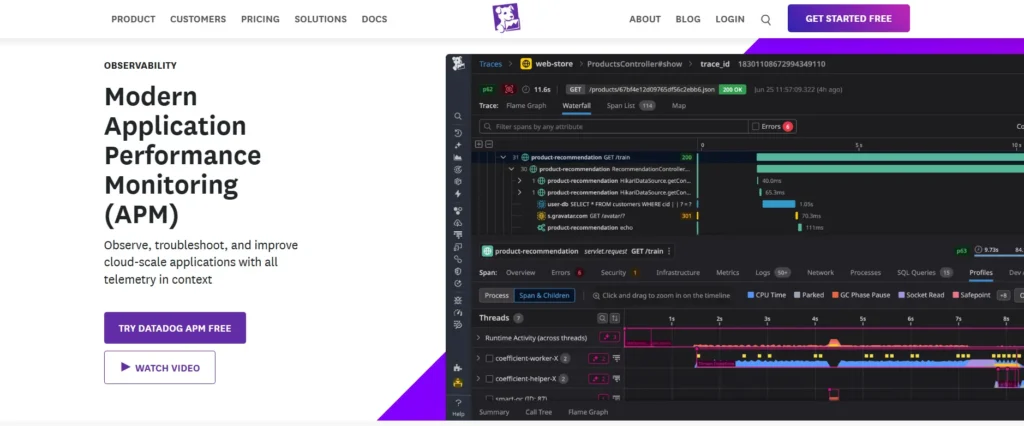
Datadog is a popular application monitoring tool that helps you get fast and flexible ingestion for full-stack visibility. If you want an APM platform with AI-powered capabilities for quick and precise incident detection, then Datadog can be your ideal choice. It allows you to accelerate investigations with error and latency outliers and minimize performance degradations.
Features
- Identify underlying causes of issues by correlating traces with logs, infrastructure metrics, database queries, network calls, and frontend telemetry in one view
- Understand the impact of incidents across services and databases by querying trace data with relational operators
- Track and alert on business-specific KPIs via dashboards, monitors, and SLOs
- Compare error, latency, infrastructure, and code profiling metrics across app versions
Limitations
- Users report occasional customer support problems
- Alert tuning and monitor management might need regular review to avoid alert fatigue
- Building advanced dashboards can take some time
Pricing
- APM: Starts at $31 per host per month
- APM Pro: Starts at $35 per host per month
- APM Enterprise: Starts at $40 per host per month
5. Splunk AppDynamics
Best For: Critical enterprise apps where performance needs to connect to business outcomes
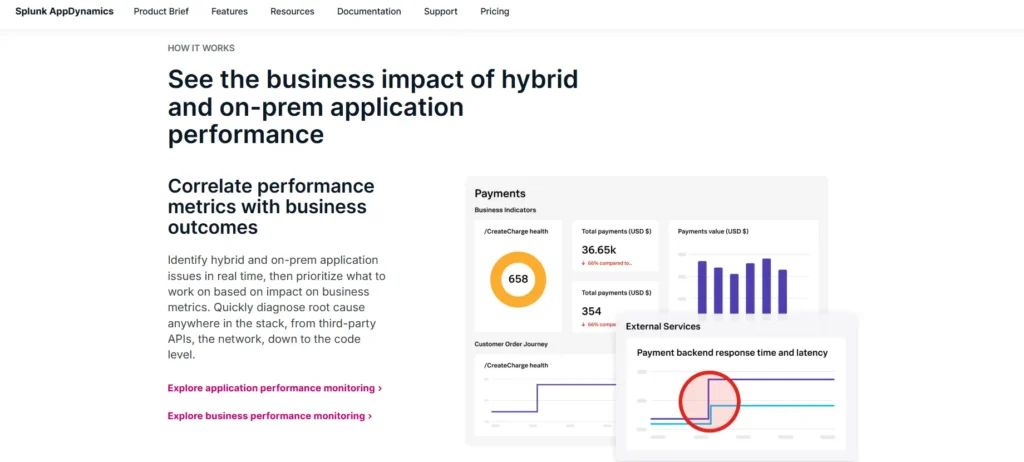
Splunk AppDynamics is one of the top web application performance monitoring tools for enterprise apps like SAP. It shows you how performance issues can affect your business. Its comprehensive analytics offer a real-time understanding of program performance and impact, with over 35 pre-configured dashboards and more than 350 metrics and KPIs.
Features
- Precisely identify hybrid and on-prem application issues in real time
- Prioritize what to work on based on impact on business metrics
- Diagnose the root cause of issues in third-party APIs, your network, or in the code
- Optimize the performance of key user journeys like logins, shopping cart additions, and checkouts
Limitations
- Pricing is expensive compared to competitors
- Some users say the interface is cluttered and therefore finding information quickly is tricky
- Agent upgrades may need to be done manually
Pricing
- Starts at $55 per host, per month, billed annually
Also Read: Ecommerce Performance Testing: What to Test and How to Scale
6. Elastic APM
Best For: OpenTelemetry-native app monitoring and distributed-system troubleshooting
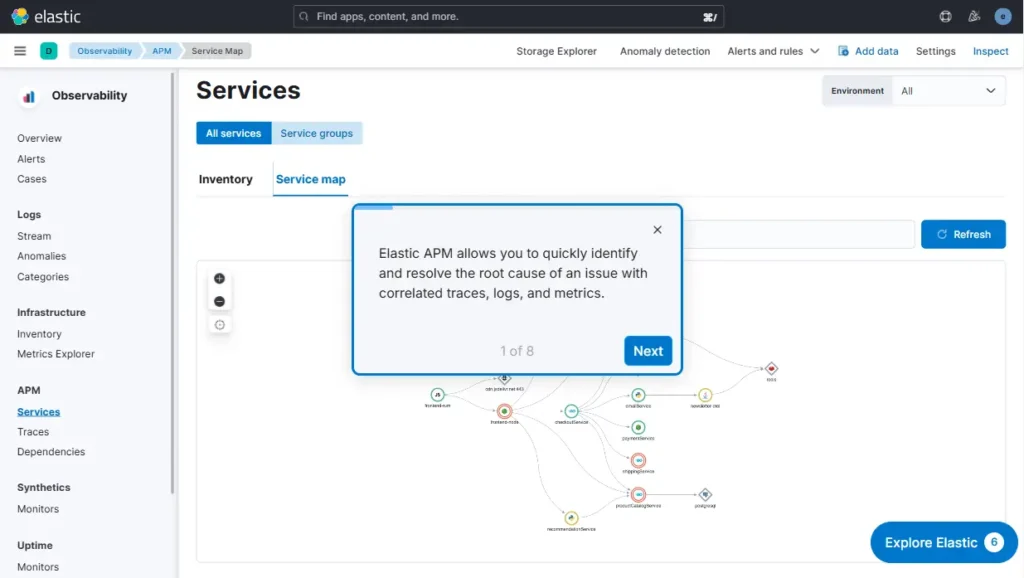
If you’re searching for application monitoring tools with robust mobile performance monitoring features, then Elastic APM should be at the top of your list. It helps you correlate with the backend so you get full end-to-end context of performance. And the tool fits into any dev environment for modern or legacy apps and has support for popular languages and their frameworks, including Java, .NET, Python, Go, Node.js, Ruby, PHP, and C++.
Features
- Bring OTel-native traces, logs, and metrics into Elastic from any third-party OTel tool
- Automatically correlate root causes of issues by identifying outliers, patterns, and changes with machine learning
- Instrument iOS and Android apps to monitor mobile performance
- Understand transaction latency issues and application errors and failures with Elastic AI assistant
Limitations
- The search bar has limited filter options
- Free trial is limited to only a few features
- Smaller community compared to other tools in the place
Pricing
- Custom pricing on request
How to Choose the Right APM Tool
You need a detailed understanding of your app’s architecture, team dynamics, and budget before you pick an application monitoring software. Check your app’s topology, the services it depends on, and how those service dependencies interact with one another.
Then consider the subscription costs, along with telemetry volume, agents, and additional monitoring features, and see if it fits with your testing requirements. Also, match the tool with your team’s skills. Your developers may prioritize code-level diagnostics. QA and DevOps teams may need performance metrics and test environment visibility.
Lastly, look at the integration support with cloud platforms, frameworks, CI/CD tools, and observability systems. The best way you can know if a particular tool aligns with your requirements is by utilizing the free trials.
You can request a free trial of TestGrid to see if it’s the right choice for your team.
Frequently Asked Questions (FAQs)
Why are application performance monitoring tools important?
Application performance monitoring software is critical because they help you spot performance issues early and understand their underlying causes. This enables faster troubleshooting, improves your app’s reliability, and allows you to deliver a smoother experience to users.
Which APM monitoring tools are suitable for large enterprises with complex testing needs?
TestGrid, Dynatrace, and Datadog are some of the best options for enterprises that need to monitor complex and large-scale apps. These tools have capabilities like performance testing, distributed tracing, dependency mapping, infrastructure monitoring, usage metrics, and performance diagnostics.
What are the best application performance monitoring tools with AI capabilities?
TestGrid, Dynatrace, and New Relic are some of the top application performance monitoring tools that come with AI-native features to help you with performance analysis, anomaly detection, intelligent insights, faster issue detection, and root cause analysis.


