CoTester 2.0 is LIVE! Your Always-Available AI Teammate for Testing.
- What Is Scalability Testing?
- Scalability Testing Techniques and Approaches
- How to Automate Scalability Testing: The Complete Workflow
- Scalability Testing Tools
- Key Metrics to Measure During Scalability Testing
- Building Infrastructure for Scalability Testing
- How TestGrid Helps Evaluate Application Scalability
- Frequently Asked Questions (FAQs)
You know your application can handle 5,000 users.
What happens at 10,000?
More importantly, what happens between the two? Does throughput rise with the additional capacity? Do response times remain within your SLO? Does the database become the bottleneck? Does autoscaling respond quickly enough, or does performance deteriorate before new resources arrive?
Scalability testing answers those questions by examining how application performance changes as workload and system capacity increase.
In this guide, you’ll see how to model that growth, choose the right scalability testing techniques, measure scaling efficiency, and identify the infrastructure limits that determine how far your application can go.
Request a free trial to evaluate your application under load with TestGrid.
TL;DR
- Scalability testing checks how well an application maintains acceptable performance as user traffic, transactions, or data-processing demands increase.
- Different scalability testing techniques include load testing, stress testing, spike testing, soak testing, capacity and volume testing, vertical and horizontal scaling
- To monitor your app’s performance, you can use observability tools like Grafana, Datadog, New Relic, Dynatrace, Prometheus, and AWS CloudWatch
- Some important scalability metrics are response time, network bandwidth, memory and CPU utilization, error rate, and throughput
- Some top tools you can leverage to assess scalability are TestGrid ONE, K6, Grafana, Gatling, JMeter, LoadRunner, and Locust
What Is Scalability Testing?
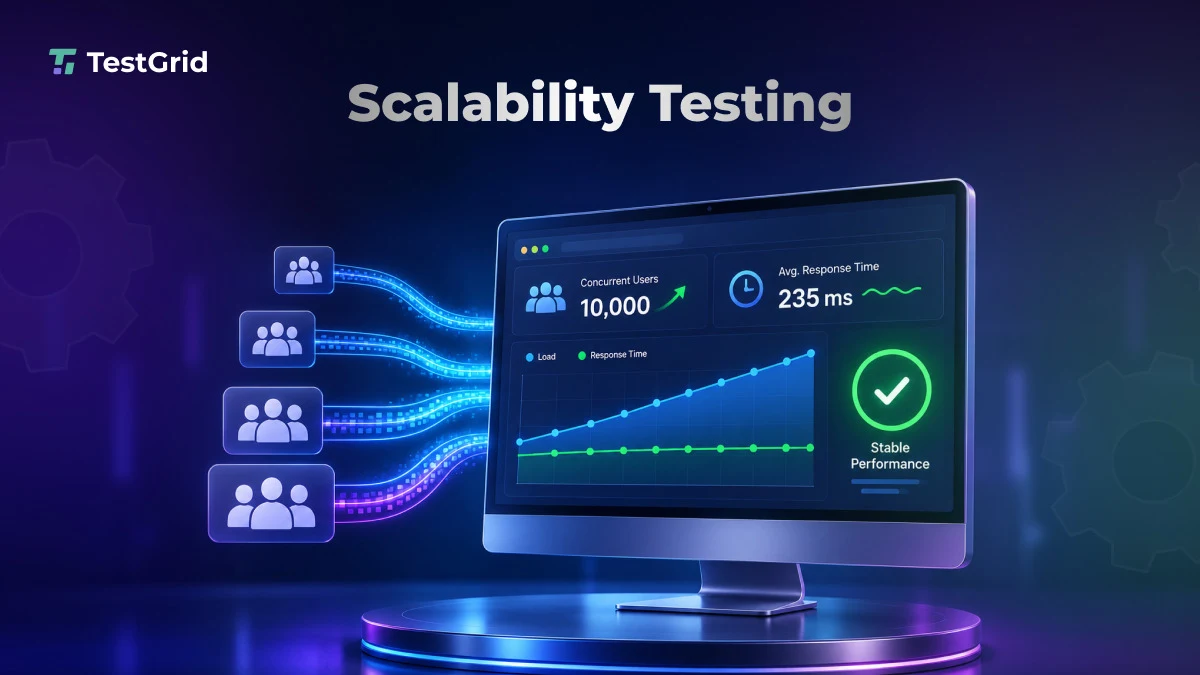
Scalability testing is a type of non-functional testing which evaluates an application’s ability to handle increasing workloads when user traffic, transaction volumes, or data demands grow.
It examines how your app’s performance changes or whether it degrades when it has to accommodate higher demand. Scalability testing is also a type of performance testing.
Here, your goal is to determine whether the application maintains acceptable response times, throughput, stability, and resource utilization as workload increases and, where applicable, as infrastructure scales up or out.
This test helps you identify resource and infrastructure limitations before crashes or downtime due to increased workloads affect end users.
Are scalability and elasticity related?
Yes, but they’re different. Scalability describes how well a system handles growth as capacity changes, while elasticity describes its ability to add or remove resources dynamically.
When autoscaling is involved, tests should also examine scaling efficiency, bottlenecks, graceful degradation, and recovery time as demand changes.
Scalability Testing Techniques and Approaches
1. Load testing
Load testing helps you assess application performance as concurrent users, requests, or transactions increase. If autoscaling is configured, you can also observe whether scaling policies respond as expected under load.
Also Read: Best Load Testing Tools (Open Source & Paid)
2. Stress testing
Stress testing pushes your app beyond its expected operating capacity by increasing the user traffic or data volume progressively. This enables you to spot performance degradations, resource limits, and breaking points, and evaluate if the app is able to recover gracefully after an error.
3. Spike testing
Spike testing is done to check how an app responds to sudden, extreme increases in traffic over a short period.
In scalability testing, spike tests show how the application responds to sudden demand, whether service degrades gracefully, and, when autoscaling is configured, how quickly additional capacity becomes available.
4. Soak testing
In soak testing, you run your app under a sustained, consistent workload for an extended period to detect gradual performance degradation, memory leaks, and resource exhaustion which can affect the app’s stability.
5. Volume testing
Here, your app should be able to seamlessly manage large amounts of data, such as extensive database records or transaction histories. Volume testing lets you analyze that and lets you diagnose data-related issues and see if the system can maintain consistent performance when data volumes grow.
6. Capacity testing
You conduct capacity testing to determine the maximum workload (concurrent users, transactions, and requests) your app can process and still meet its predefined performance requirements.
This test helps you establish the system’s workload limits, find resource constraints, and estimate how much additional capacity is needed.
7. Horizontal scaling
Horizontal scaling involves adding more servers or app instances in order to distribute incoming workloads across them, rather than depending on a single machine. This lets you ensure that adding instances can increase the app’s capacity to manage concurrent requests.
8. Vertical scaling
In contrast to horizontal scaling, in vertical scaling you increase the computing resources of an existing server or instance, such as CPU cores, RAM, or storage capacity.
You don’t add more server instances here. This process helps you assess how additional resources affect your app’s performance.
Also Read: AI Performance Testing: Types, Techniques, and Best Practices
How to Automate Scalability Testing: The Complete Workflow
1. Define scalability goals and performance criteria
The first stage of the process is to establish measurable scalability goals based on expected increases in user traffic, transaction volumes, and data processing demands.
You can use Service Level Agreements (SLAs) and Service Level Objectives (SLOs) to specify the acceptable performance thresholds like response times, availability, and error rates.
2. Set up the test environment and prepare test data
Next, you need to configure your test environment. Configure a representative environment that reflects the production architecture, server configuration, databases, network behavior, dependencies, and scaling mechanisms relevant to the test.
Create realistic production-like data. Use production-like data without exposing sensitive production information. Apply masking, anonymization, or synthetic test data where appropriate, and protect stored or transmitted test data with suitable encryption controls.
3. Design realistic workload scenarios
Create test scenarios which reflect actual user behavior, including concurrent users, request rates, transaction patterns, and peak usage periods.
Your tests should simulate different traffic levels. This allows you to observe app performance, resource utilization, and processing time when demand increases.
4. Create automated test scripts
Then develop automated test scripts using performance and scalability testing tools based on the test scenarios you built.
Also, parameterize test data, configure virtual users and ramp-up rates, and define assertions so your testers can validate your performance expectations during execution.
5. Integrate scalability tests into CI/CD pipelines
Leverage tools like Jenkins, GitHub Actions, or GitLab CI to incorporate automated scalability tests into CI/CD pipelines. Use lightweight performance checks frequently in CI/CD and schedule heavier scalability tests at appropriate pre-release or scheduled intervals.
Apply quality gates where results exceed defined performance thresholds. At this point, you should implement quality gates which compare your test results against predefined performance thresholds and flag builds that violate critical criteria.
6. Monitor application performance
Track your app and infrastructure metrics throughout test execution to spot response delays, resource constraints, and unexpected behavior. You can also use observability tools to measure system performance.
Some of the popular ones available are:
- Grafana: Queries, visualizes, and creates alerts from metrics, logs, and traces
- Prometheus: Collects and stores time series metrics, and allows you to query performance data and configure alerting
- Datadog: Gives you infrastructure monitoring, app performance monitoring (APM), database monitoring, and dashboards to analyze application efficiency
- New Relic: Enables you to observe your app’s performance and offers distributed tracing and alerting to uncover performance issues
- Dynatrace: Monitors apps, infrastructure, cloud services, and their dependencies and allows you to investigate root causes of scalability problems
- AWS CloudWatch: Helps you gather and analyze logs and operational data from AWS resources, with dashboards and alarms for checking performance
You can use the findings from these tools to optimize your app code, database queries, caching mechanisms, and infrastructure configurations, and adjust resource allocation or scaling policies where necessary.
Learn More: APM Tools Application Performance Monitoring Tools
Scalability Testing Tools
Here are some testing tools that can help QA and engineering teams simulate varying workloads and optimize system performance.
- K6: This is a load testing tool with which you can test the scalability of your app and improve your reliability targets. You can also test SLOs and avoid SLA breaches. The tool helps you simulate real global traffic patterns and analyze how cloud-native systems scale.
- Gatling: This is an AI-powered performance engineering platform which enables you to ensure your websites and apps stay fast and reliable under peak traffic. You can test cloud scalability, validate API performance and microservice resilience at every stage of development, and optimize resources before going live.
- Apache JMeter: Apache JMeter is an open-source Java performance testing tool for web, database, FTP, and API load testing. It lets you mimic high traffic loads, measure throughput, response times, and error rates, and identify performance lags across apps.
- LoadRunner: OpenText Core Performance Engineering (or, LoadRunner Cloud) is a cloud-native performance testing platform for testing mobile, web, packaged, and legacy apps without the need of managing test infrastructure. It also gives you detailed metrics on response times, user concurrency, and backend throughput.
- Locust: Locust is a Python-based load testing framework. You can use it to replicate millions of concurrent users, monitor real-time performance metrics, and dynamically adjust load patterns during tests. This tool supports running load tests distributed over multiple machines.
Learn More: Best Performance Testing Tools
Key Metrics to Measure During Scalability Testing
Track the following metrics to understand how your app performance, resource consumption, and infrastructure capacity change as user load and request volumes increase.
| Metric | What it measures |
|---|---|
| Response time | Time it takes for your app to process a request and return a response |
| p95/p99 latency | Response time thresholds below which 95% and 99% of requests are completed, respectively |
| Throughput | Number of requests or transactions processed per second |
| Error rate | Percentage of requests or transactions which fail during execution |
| CPU utilization | Percentage of available CPU processing capacity that is being used |
| Memory utilization | The amount of physical or allocated memory used by your app or system |
| Disk I/O | Rate of read and write operations and the amount of data transferred to and from storage |
| Network bandwidth | The amount of data transmitted and received over the network per unit of time |
| Database query time | Time it takes for the database to execute a query and return its result |
| Connection pool usage | Number of database connections currently in use compared with the pool’s configured capacity |
| Queue depth | Number of messages or tasks waiting in a queue for processing |
Building Infrastructure for Scalability Testing
To accurately gauge your app’s scalability, you need a test infrastructure that closely resembles your production environment and is elastic so it can adjust computing resources with increasing load. The table below includes some critical components and technologies you can implement to build your infrastructure.
| Component | Description | Role |
|---|---|---|
| AWS (EC2, Auto Scaling groups) | Cloud computing and virtual server services | Automatically adds or removes server instances based on the demand |
| Microsoft Azure (VM Scale Sets) | Service for managing groups of virtual machines | Scales virtual machine instances as per workload demands |
| Google Cloud | Cloud computing platform | Gives you scalable computing, storage, and networking resources |
| Docker | App containerization platform | Packages your apps for consistent deployment across environments |
| Kubernetes Horizontal Pod Autoscaler (HPA) | Kubernetes autoscaling controller | Automatically adjusts the number of pod replicas based on observed resource utilization or configured custom/external metrics |
| Load balancer | Traffic distribution mechanism | Distributes requests across multiple server instances |
| CDN | Distributed content delivery network | Helps you reduce origin server load through content caching |
| Redis | In-memory data storage and caching | Reduces repeated database queries and data retrieval time |
| Kafka | Asynchronous messaging system | Allows you to distribute processing tasks and decouple app services |
| API gateway | Central entry point for API requests | Routes requests to appropriate backend services |
How TestGrid Helps Evaluate Application Scalability
TestGrid is an AI-native testing company. TestGrid ONE, its AI operating system that runs quality engineering, includes performance and load testing alongside web, mobile, API, visual, audio, and enterprise application testing.
For scalability testing, you can execute Apache JMeter test plans on TestGrid, configure virtual users, ramp-up time, duration, and test data, and review execution logs and performance reports after each run.
TestGrid also captures performance signals across web and mobile workflows. On real Android and iOS devices, you can monitor CPU and memory usage, battery impact, network activity, and UI response time while testing application behavior under different operating conditions.
Scriptless tests can provide application and device-level performance results, while JMeter-based workflows support load and stress simulation. You can also evaluate behavior under varying network conditions and use execution evidence to investigate where performance degradation appears.
Performance tests can be incorporated into delivery workflows through integrations with Jenkins, GitHub Actions, GitLab, and Azure DevOps.
TestGrid ONE can be deployed through private dedicated cloud, on-premises, or hybrid environments based on your infrastructure and security requirements. Optimize application performance with TestGrid. Request a free trial today.
Frequently Asked Questions (FAQs)
What is the difference between scalability testing and performance testing?
Performance testing evaluates characteristics such as response time, throughput, stability, and resource usage. Scalability testing focuses specifically on how those characteristics change as workload or system capacity increases.
What is a scalability index?
A scalability index measures how efficiently system capacity or throughput improves as resources increase. There’s no single universal formula; teams typically define scaling efficiency against their architecture, workload model, and performance objectives.
What is database sharding and replication in scalability testing?
Sharding partitions data across multiple database nodes to distribute workload. Replication copies data across nodes to improve read capacity and availability. Scalability tests can evaluate routing, replication lag, hotspots, consistency, and behavior as database demand grows.
What are some scalability testing examples?
Examples include testing an eCommerce site for Black Friday traffic, increasing concurrent users on a SaaS application, scaling payment transactions during peak periods, or measuring how an API behaves as requests and backend instances increase.