Advanced Reporting
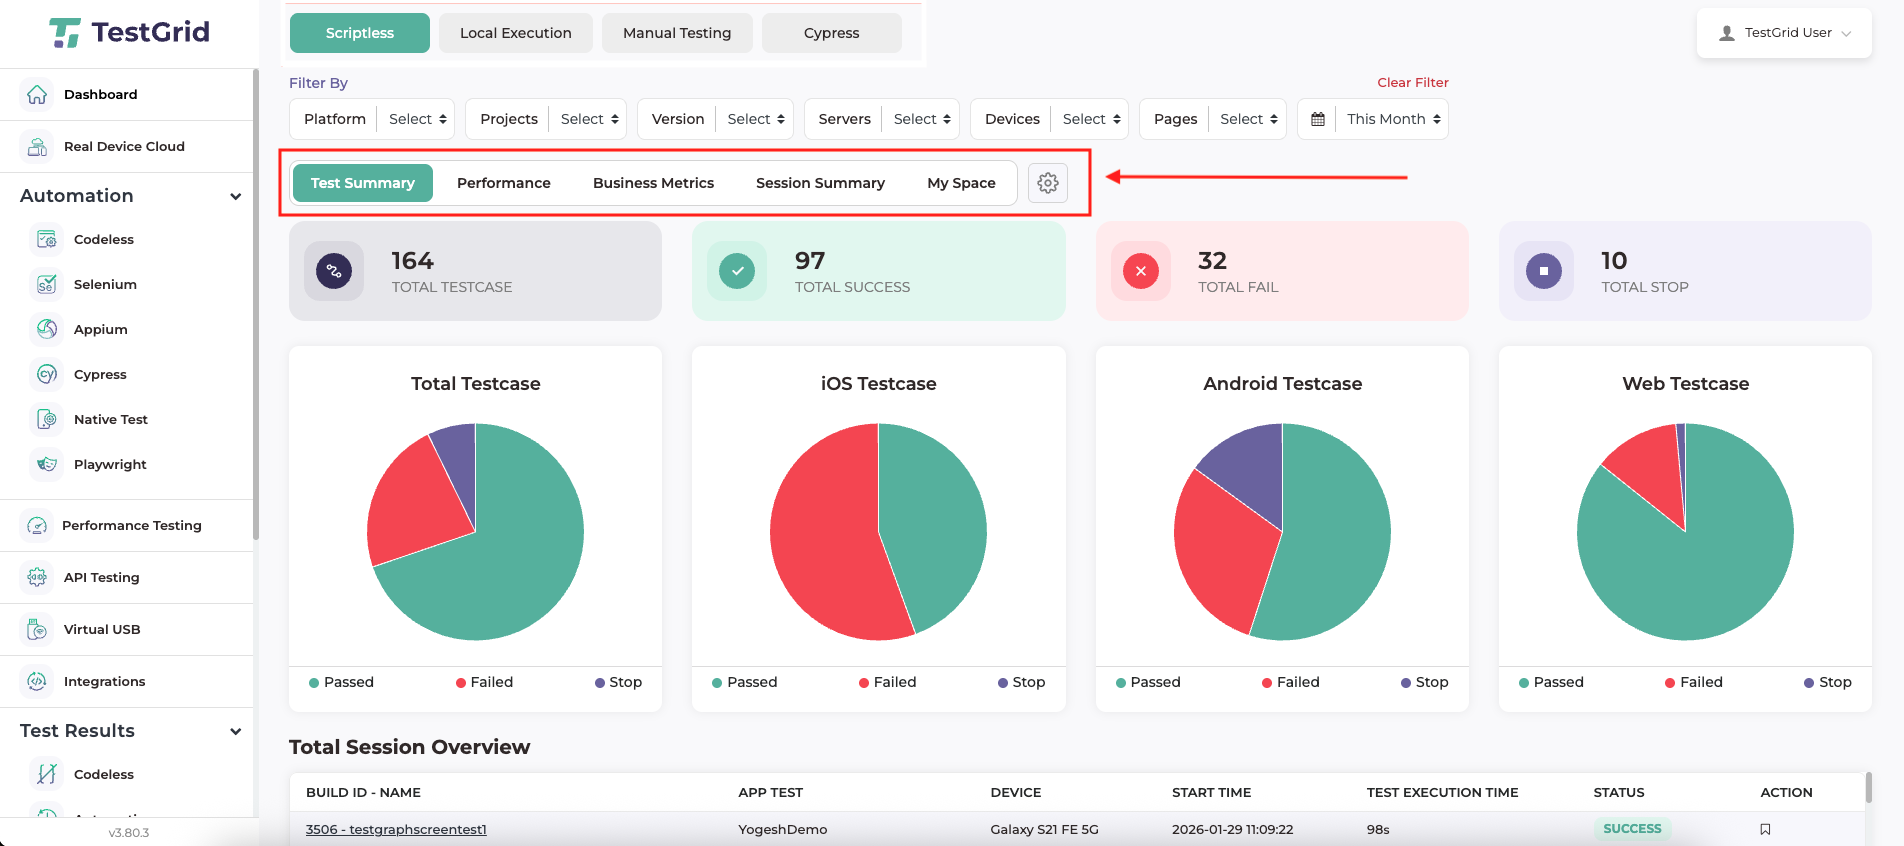
The TestGrid Dashboard is a centralised reporting and analytics interface that provides complete visibility into test execution activities across multiple testing types, platforms, and environments. It is designed to help quality assurance teams, test leads, and stakeholders effectively monitor application quality and overall test health.
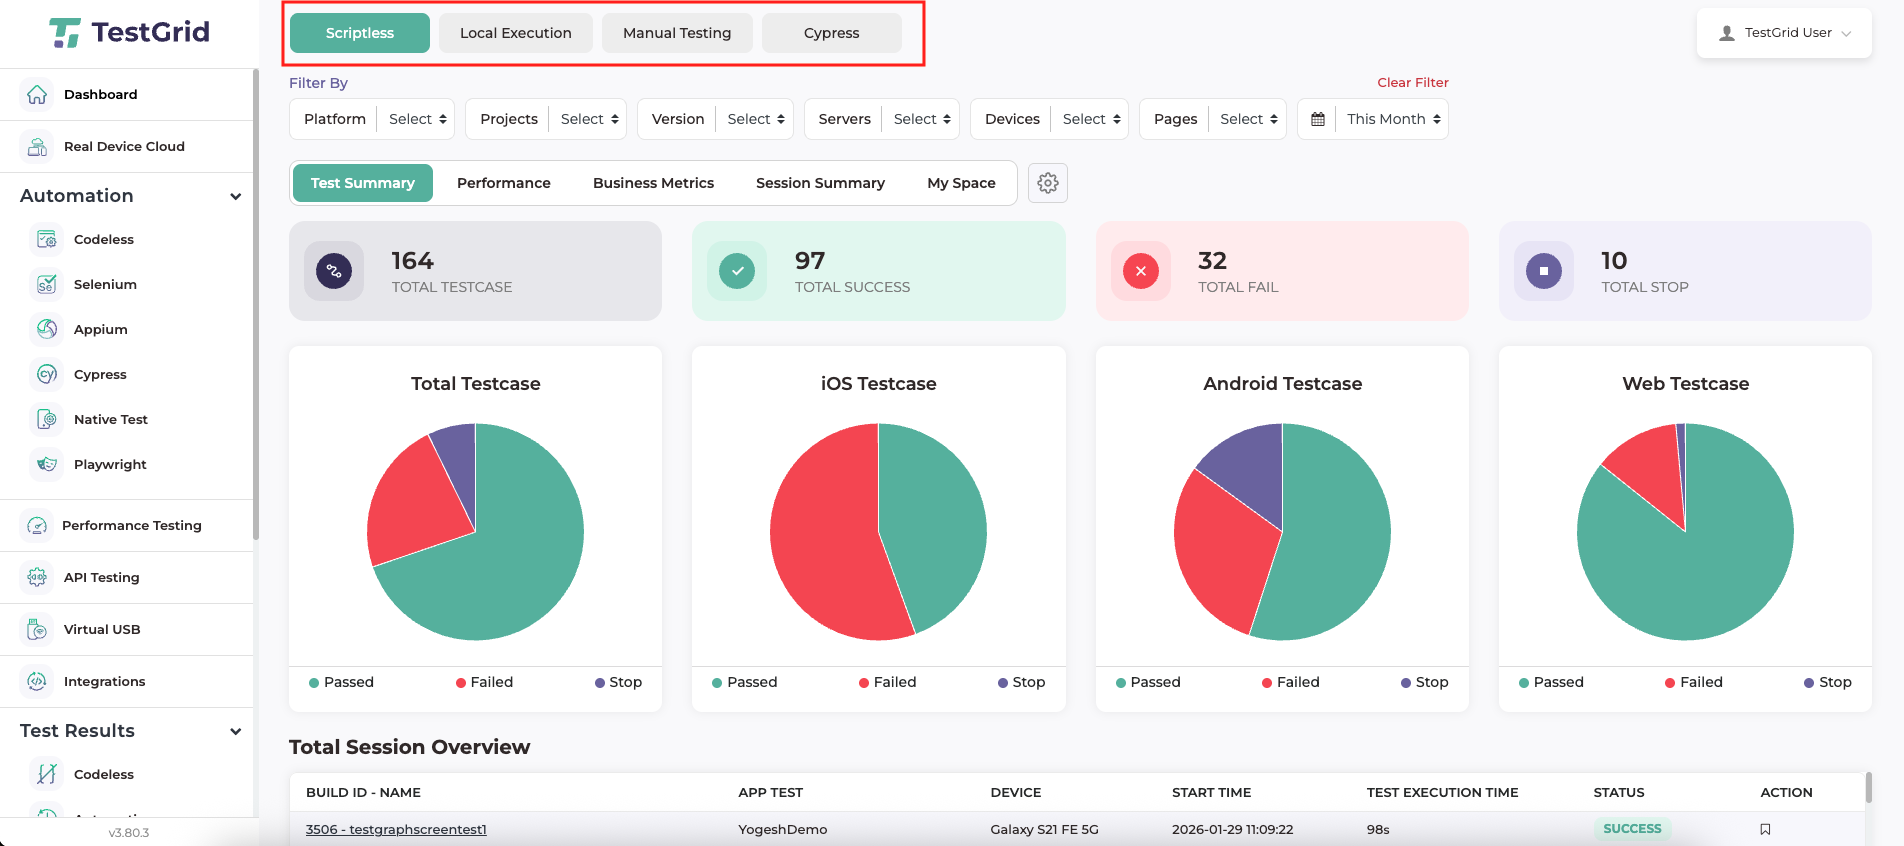
All Types of Testing Reports
TestGrid provides a unified reporting framework for all testing activities executed within the platform. Reports are organised by testing type, ensuring that each execution category is presented in its own dedicated view. The dashboard supports reporting for Local Execution, Scriptless Testing, Manual Testing, and Cypress Automation, with each view displaying data relevant only to the selected testing method.
Filters Available in TestGrid Dashboard
The TestGrid Dashboard provides a comprehensive set of filters that allow users to refine and customise test reports based on specific criteria. These filters help users focus on relevant test execution data and perform targeted analysis across projects, platforms, devices, and time ranges.
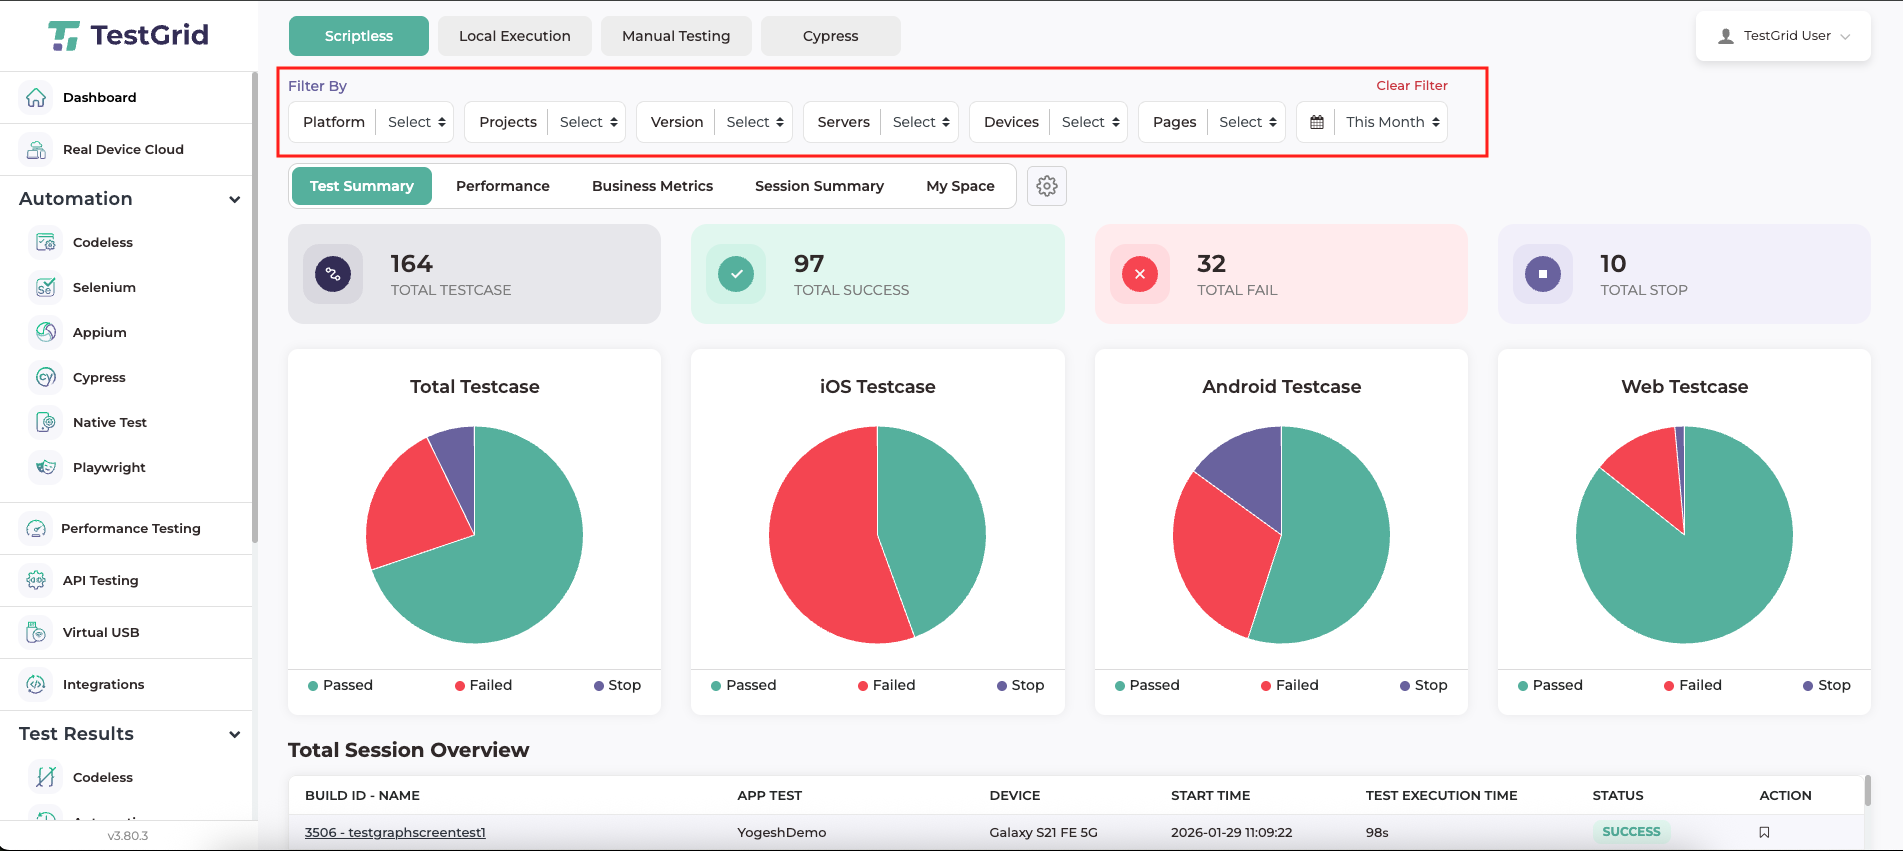
- Platform
- The Platform filter allows users to view test reports specific to a selected platform. Users can filter reports based on iOS, Android and Web. This filter helps in analysing platform-specific behaviour and identifying issues unique to a particular platform.
- Project
- The project filter enables users to view reports related to a specific project. By selecting a project, only test executions associated with that project are displayed in the dashboard. This is useful when managing multiple projects within the same TestGrid account.
- Version
- The Version filter allows users to view reports based on a specific version of the project. This helps in comparing test results across different versions and tracking regression stability for a particular version.
- Server
- The Server filter enables users to view test reports executed on a specific server. This is useful for analysing test results across different execution environments, such as primary servers or secondary servers.
- Device
- The Device filter allows users to view test results executed on specific devices. Users can select individual device models to analyse device-specific behaviour and identify issues related to particular hardware or configurations.
- Page
- The Page filter enables users to view reports related to test executions performed on a specific application page or screen. This helps in isolating failures or validating behaviour for particular areas of the application.
- Duration
- The Duration filter allows users to view test reports for a selected time range. Available options include today, yesterday, this week, last week, this month, last month, 3 months, 6 months, this year, and last year.
This filter is useful for trend analysis and reviewing historical test execution data over different time periods.
Dashboard Sections
-
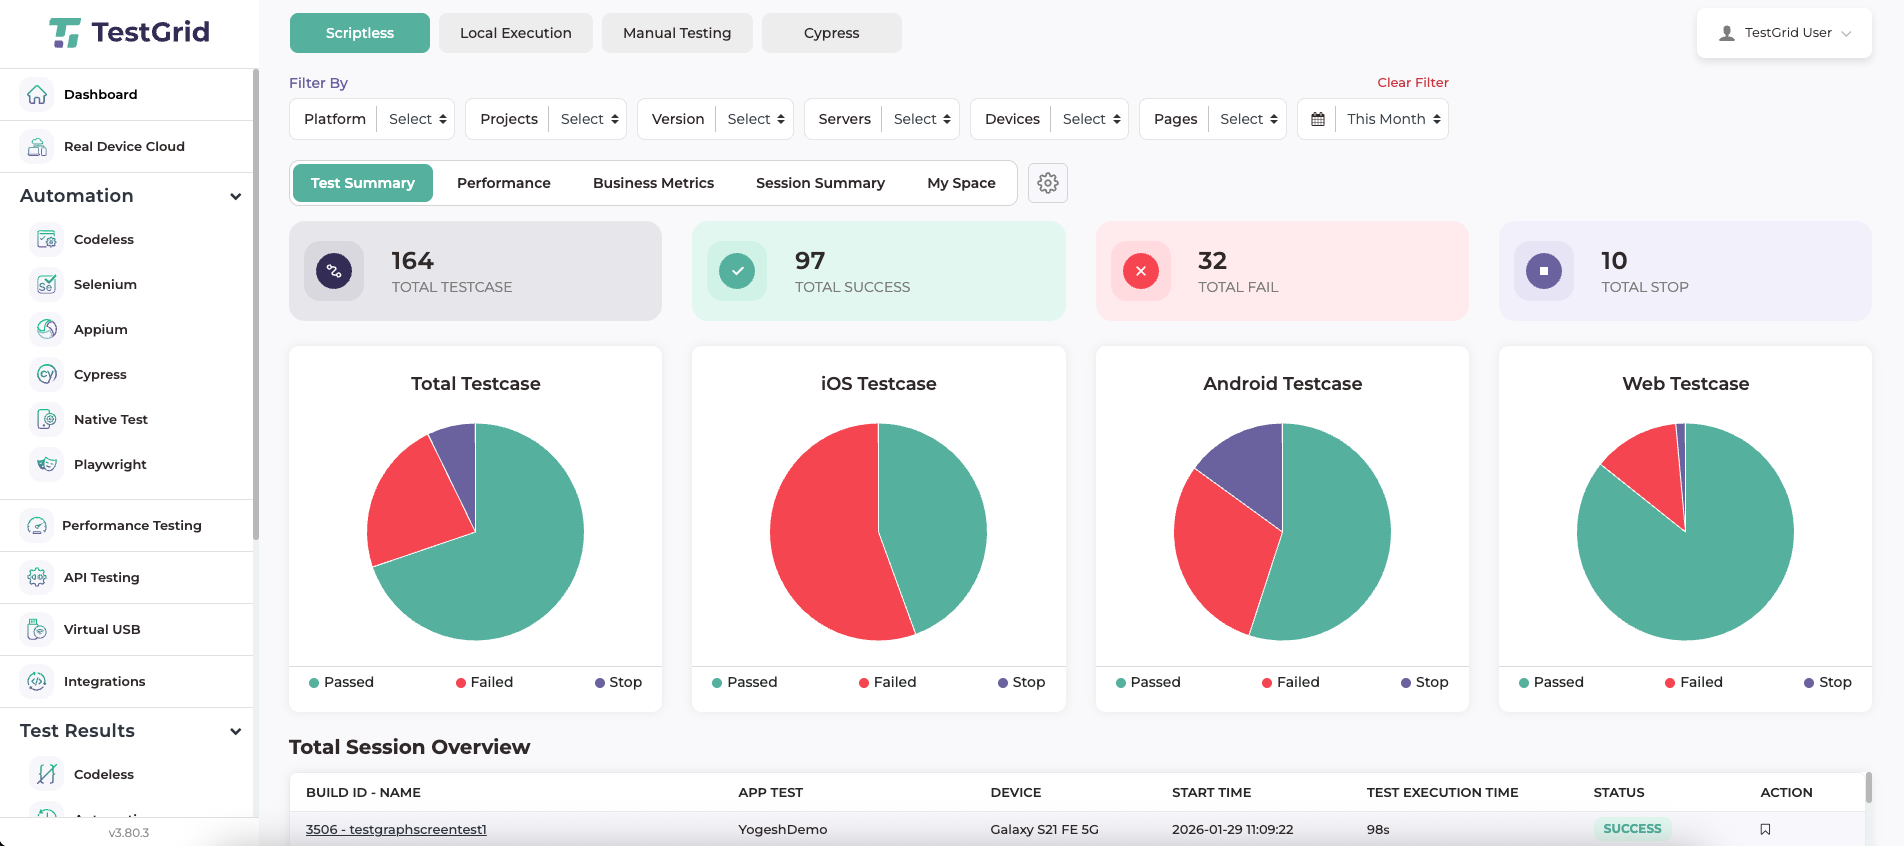
Test Summary
- The Test Summary section provides a high-level overview of overall test execution status. It displays key metrics such as the total number of test cases executed, along with their pass, fail, and stopped statuses. Visual representations, such as charts, help users quickly understand test health across platforms and projects.
-
This section is primarily used for:
- Monitoring overall test stability
- Quickly identifying failing test executions
-
Each summary metric is interactive and allows deeper analysis. Clicking on Total Test Cases in the UI displays the full list of test run executions. Clicking on Total Success, Total Fail, or Total Stop displays the corresponding list of test cases filtered by their execution status. This enables users to easily drill down from high-level metrics to detailed execution results.
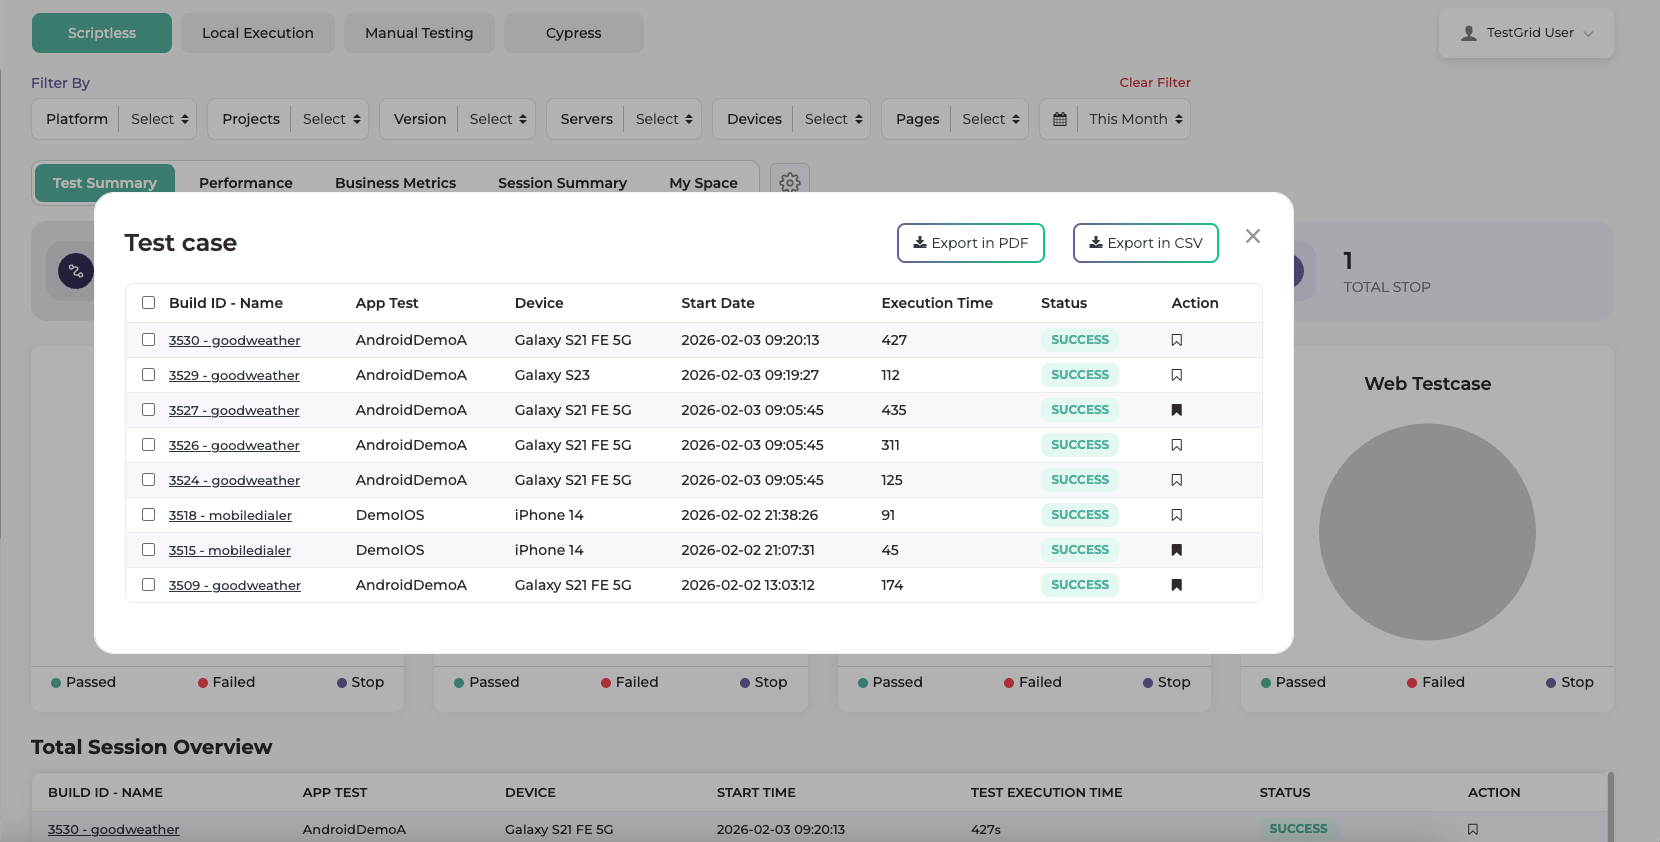
The screenshot below illustrates that Clicking on Total Success displays the list of successfully executed test cases. From this view, users can export the results in CSV or PDF format. Additionally, users can open an individual test case to view detailed execution results.

- The Total Session Overview displays the complete list of test executions. From this view, users can open a specific test execution to review its detailed results. Users can also save individual test executions, and the saved execution results are accessible from the My Space section for future reference.
-
Performance Data [Key performance indicators (KPIs)]
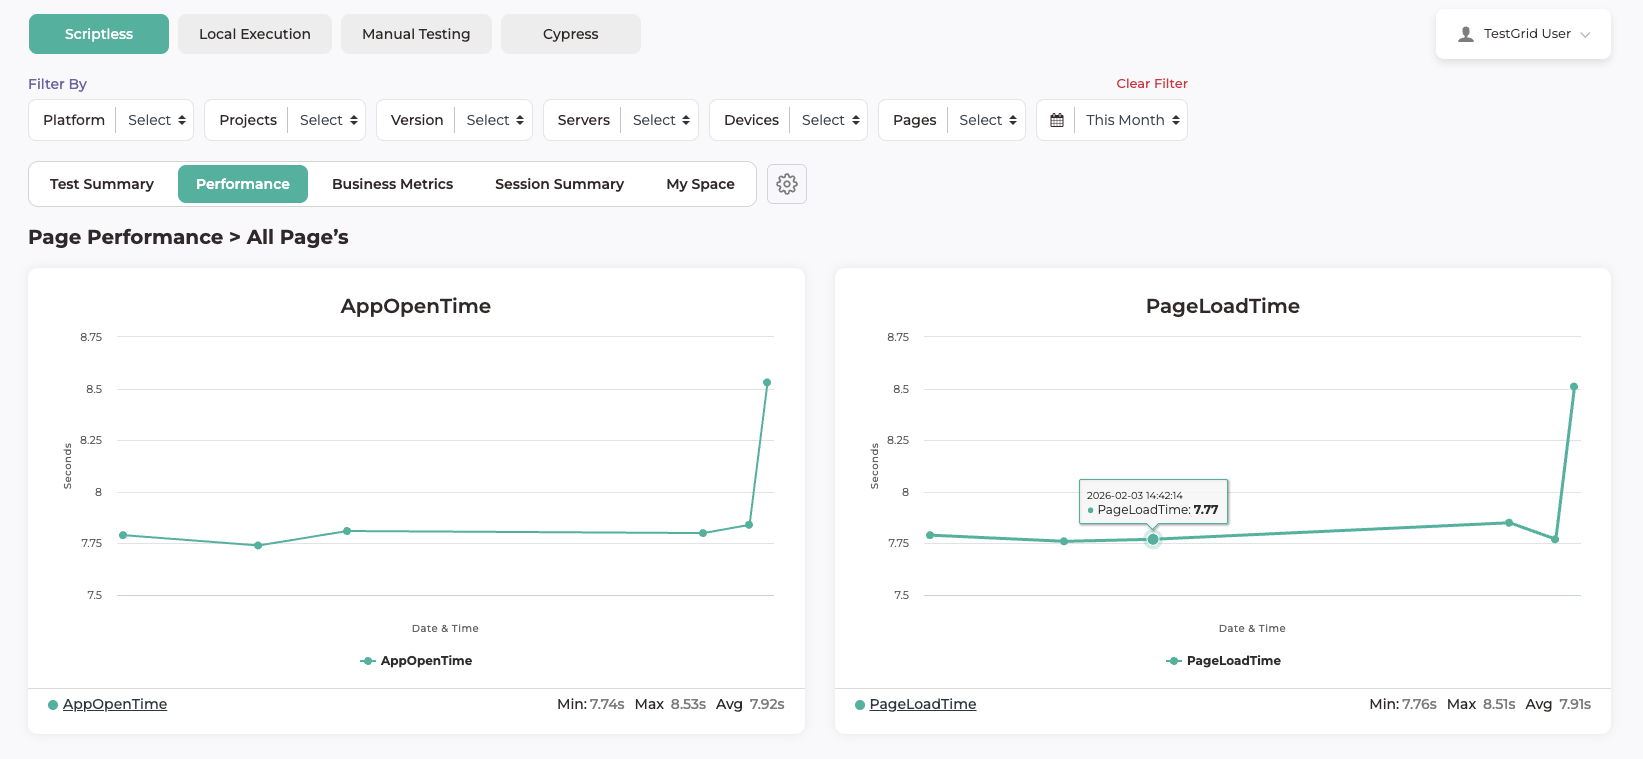
- The Performance section provides insights into application behaviour during test execution by measuring page load start and page load end keywords. It helps users understand how efficiently the application responds and completes actions during test runs. These metrics enable evaluation of test step execution speed and overall application responsiveness.
- The image below illustrates the Page Load Time for a particular test case across multiple executions, showing how long the page took to load during each run.
 Page Performance ViewsTestGrid provides multiple-page performance views to help users analyse application performance from different perspectives. These views present page load metrics using visual charts for effective comparison and analysis.
-
Page Performance – All Pages
This view displays performance charts for all application pages. It helps users understand how different pages perform during test execution by showing page load times across multiple test runs.
-
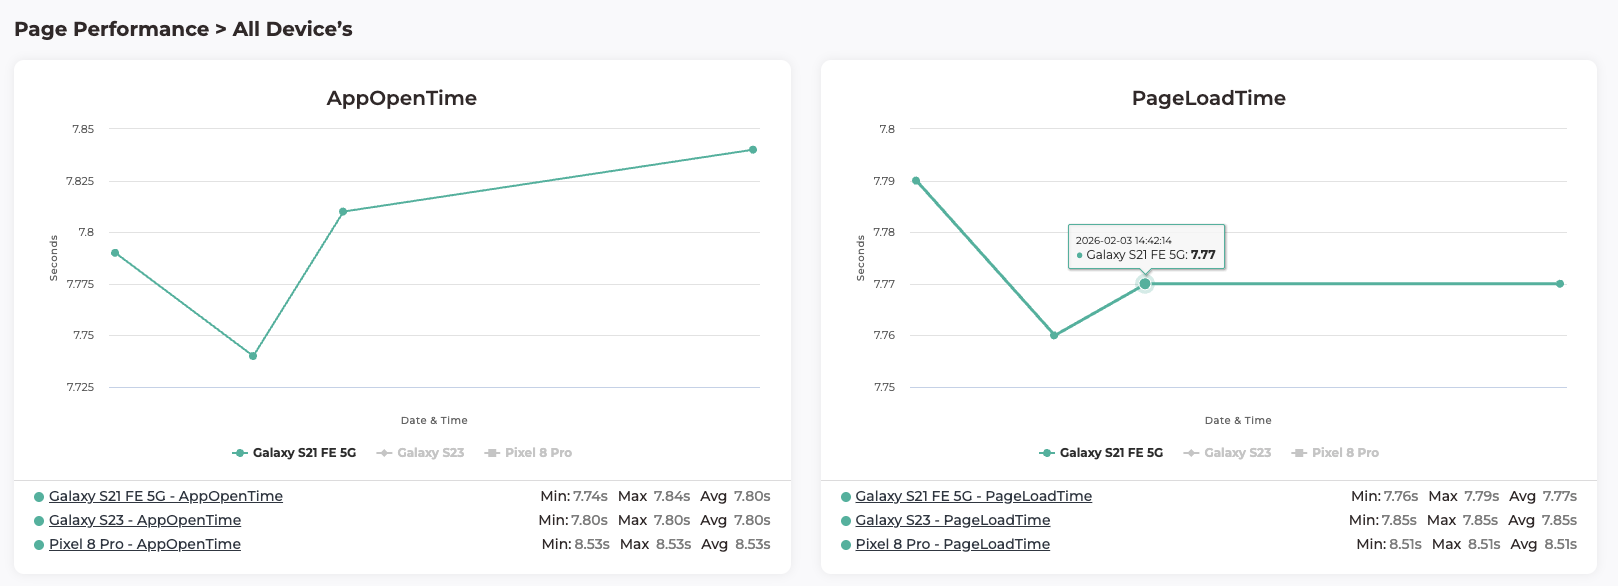
Page Performance – All Devices
This view presents page performance data across all devices used during test execution. It allows users to analyse how page load times vary on individual device models and identify device-specific performance issues.
The image below illustrates that, after selecting a specific device, the page load time for that device (Galaxy S21 FE) is displayed across multiple test executions, showing how long the page took to load during each run.

-
Page Performance – All Platforms
This view displays page performance metrics across supported platforms, such as Android and iOS. It helps users compare how long pages take to load on each platform and identify platform-specific performance differences.
-
Page Performance – All Locations
This view shows page performance metrics across all execution locations. It enables users to analyse how network conditions or geographic locations impact page load times and overall application performance.
-
-
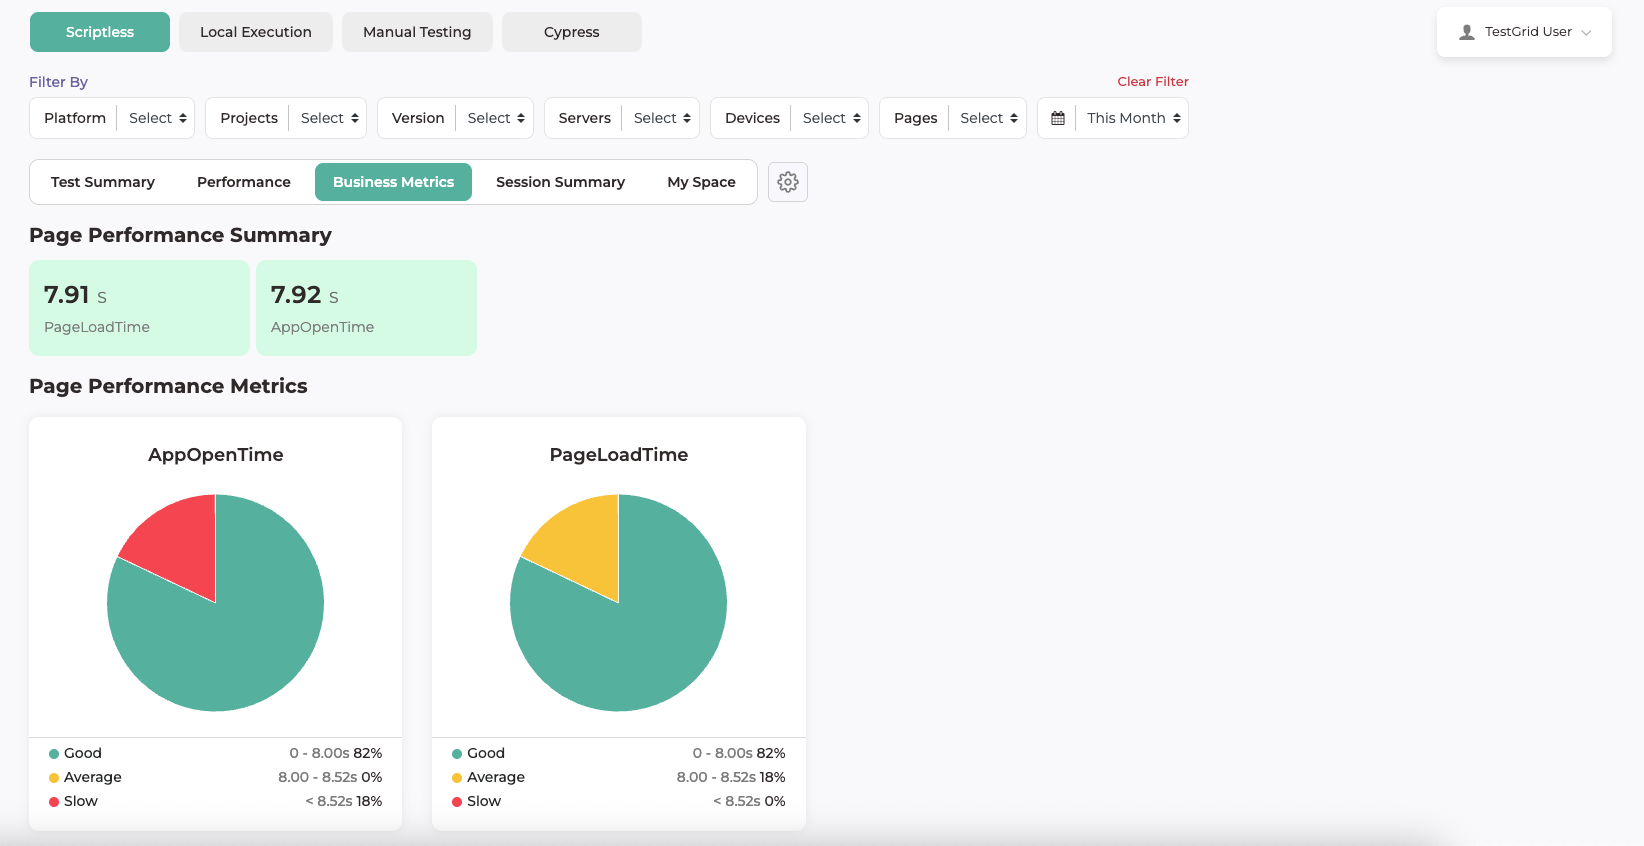
Business metrics
- Business Metrics provides a high-level summary of page performance, including overall Page Performance Time. It also presents detailed Page Performance Metrics, categorising performance as Good, Average, or Slow based on defined thresholds. This helps users quickly assess how well the application is performing during test execution and identify any potential performance issues at a glance.

- Business Metrics provides a high-level summary of page performance, including overall Page Performance Time. It also presents detailed Page Performance Metrics, categorising performance as Good, Average, or Slow based on defined thresholds. This helps users quickly assess how well the application is performing during test execution and identify any potential performance issues at a glance.
-
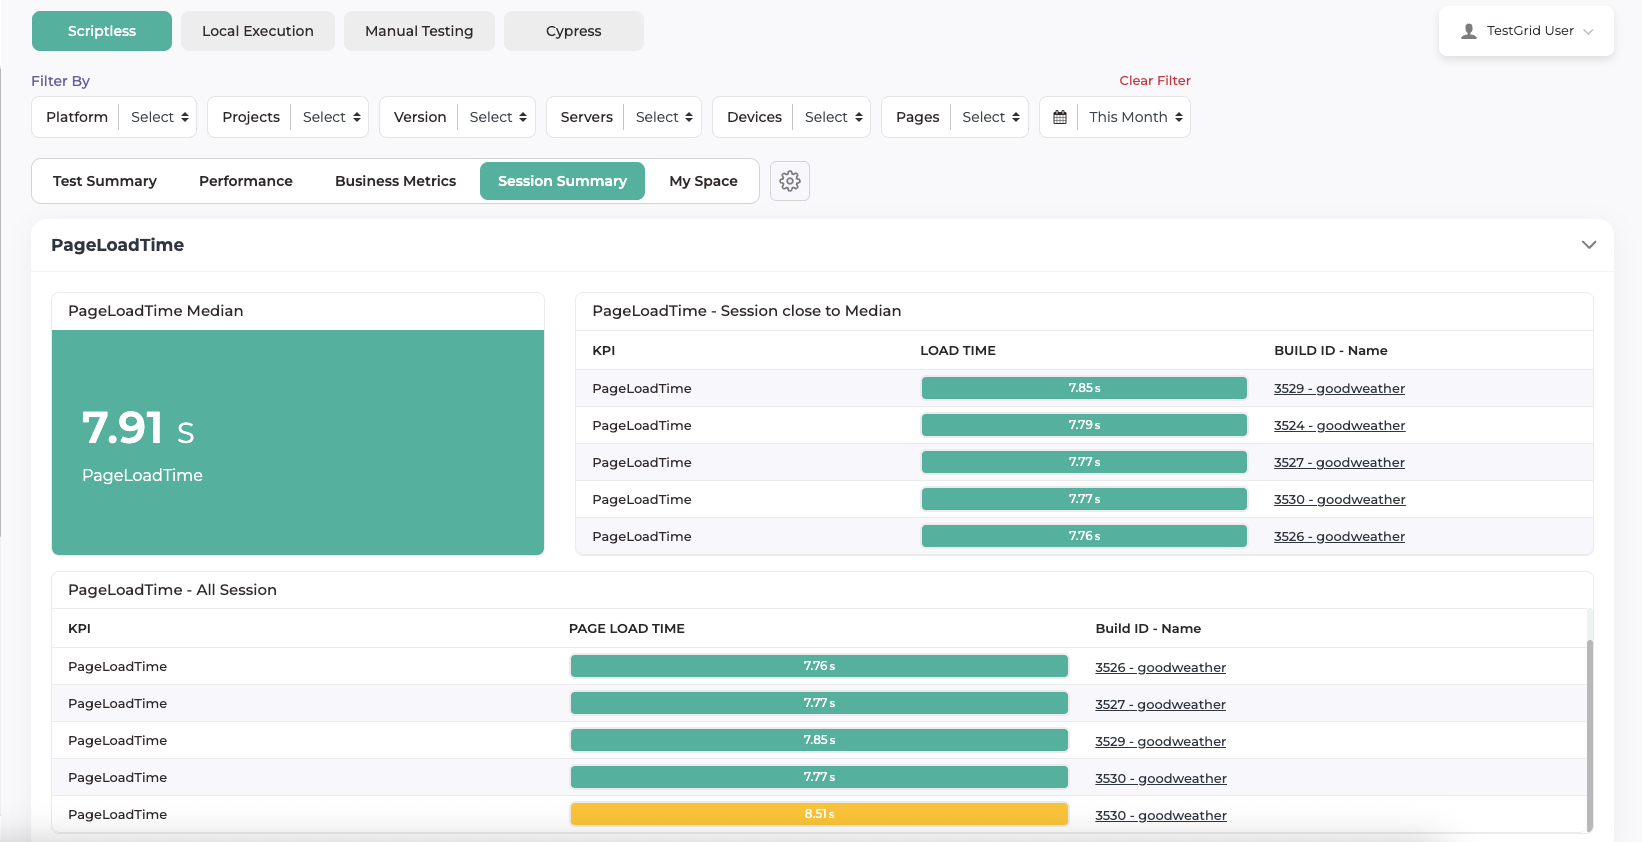
Session Summary
-
The Session Summary section provides an overall summary of test executions with a focus on page performance. It displays key performance indicators such as page load time, including the median page load time, sessions closest to the median, and page load times across all test sessions.

This view helps users:
-
Understand overall application performance across executions
-
Compare page load times between different builds
-
Identify sessions with slower or faster performance
-
Quickly spot performance variations using visual indicators
By consolidating performance data at the session level, Session Summary makes it easier to analyse trends and detect potential performance issues across multiple test runs.
-
-
-
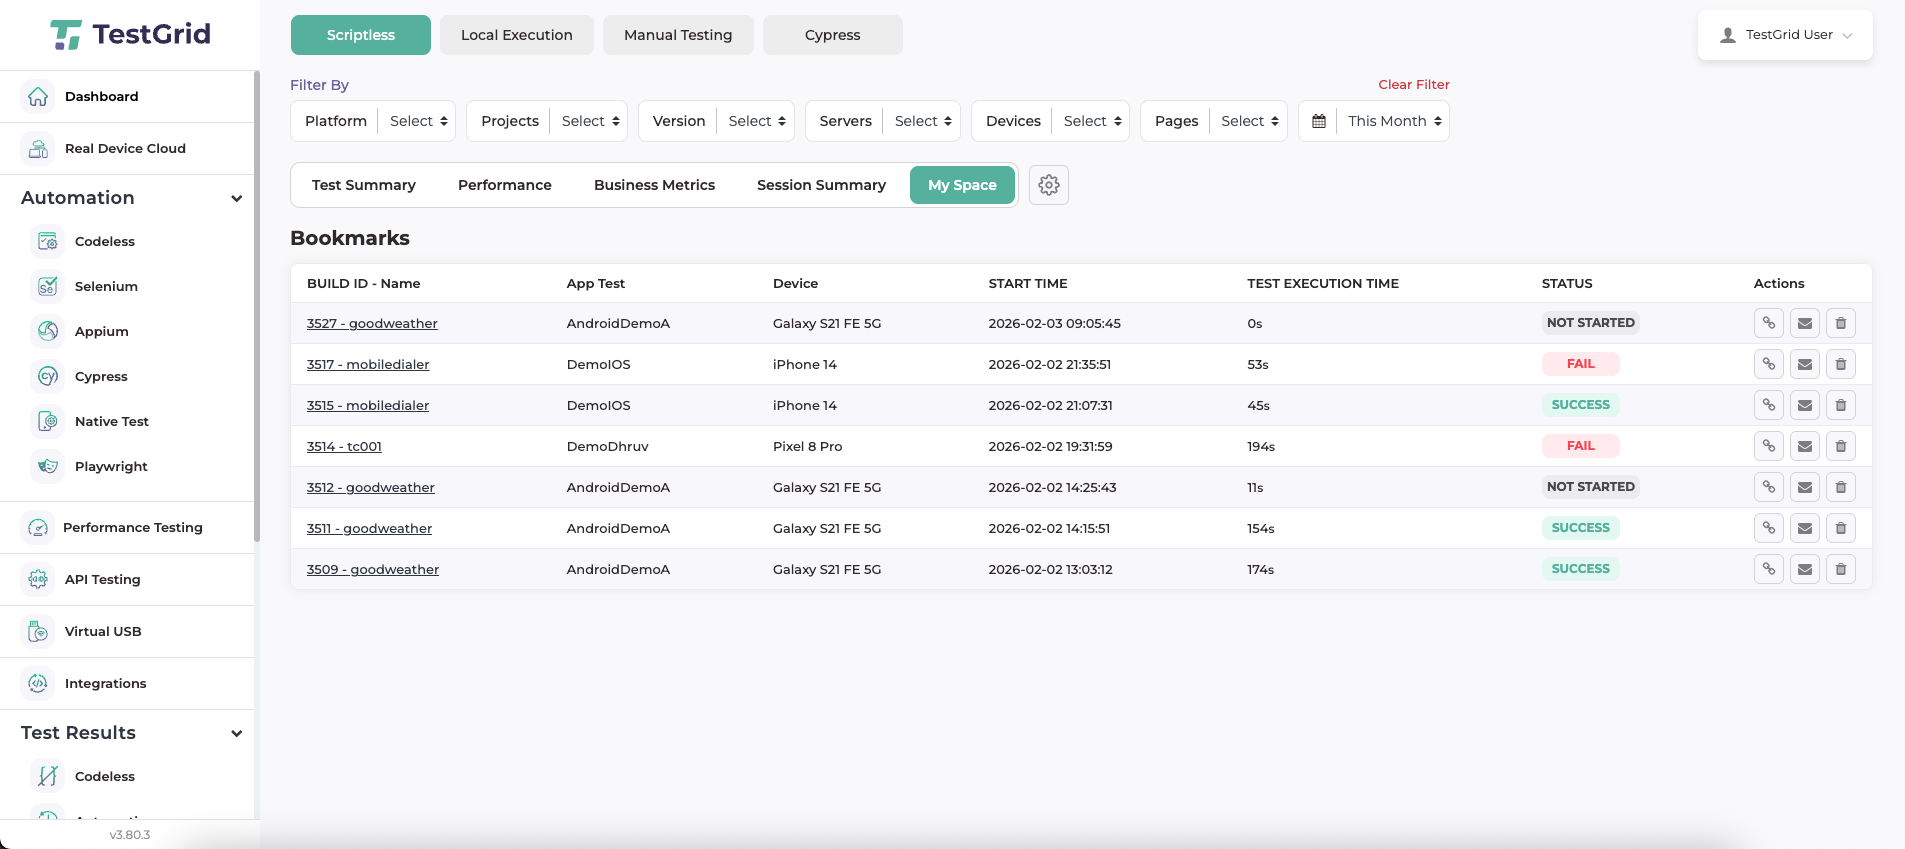
My Space
- My Space section allows users to view and manage their saved test execution results in one centralised location. From this section, users can share, delete, or copy the link of a saved test execution. Users can also remove a saved test execution when it is no longer required.

- My Space section allows users to view and manage their saved test execution results in one centralised location. From this section, users can share, delete, or copy the link of a saved test execution. Users can also remove a saved test execution when it is no longer required.
-
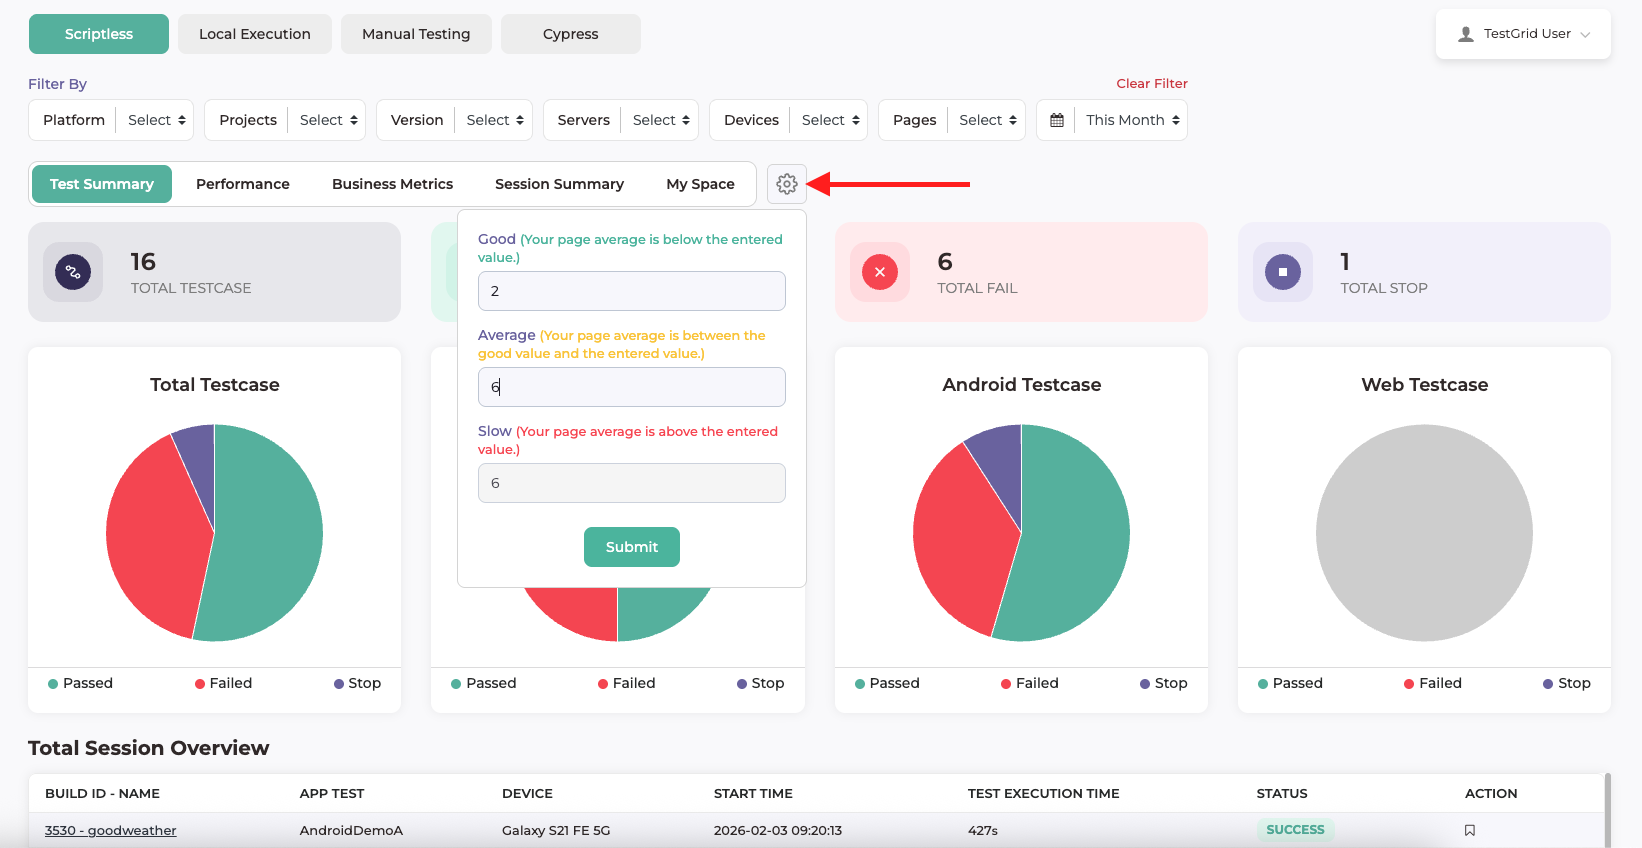
Performance Threshold Settings

By clicking the Settings (⚙️) icon on the Dashboard, users can customise the performance thresholds used to classify page load times as Good, Average, or Slow.
Users can define:
-
Good: Page load time below the entered value
-
Average: Page load time between the Good and Average values
-
Slow: Page load time above the entered value
After updating the values and clicking Submit, all performance metrics, charts, and summaries across the dashboard are updated based on the configured thresholds. This allows users to align performance evaluation with their application’s expectations and performance standards.
-
 Page Performance ViewsTestGrid provides multiple-page performance views to help users analyse application performance from different perspectives. These views present page load metrics using visual charts for effective comparison and analysis.