
Central Repository for User Recordings Videos
Overview:
A central repository in TestGrid acts as a unified and organized hub where all testing-related information is collected, stored, and managed in one place. It is designed to streamline test management by providing easy access to test cases, test data, execution results, logs, reports, and artifacts across projects and teams.
In TestGrid, the central repository enables teams to maintain consistency and reusability by storing reusable assets such as test cases, data sets, configurations, and scripts. Information is structured and indexed using metadata, making it simple to search, track, and retrieve relevant details whenever needed. Role-based access control ensures that users can view or modify data according to their permissions, maintaining security and data integrity.
By centralizing all testing assets and results, TestGrid improves collaboration, reduces duplication of effort, enhances traceability, and provides better visibility into testing progress and quality metrics. This centralized approach helps teams work more efficiently, make informed decisions, and ensure high-quality software delivery.
- The repository provides storage infrastructure to house large volumes of data. This can range from structured data (like databases) to unstructured data (like documents, images, and videos).
- Information within the repository is typically organized using categorization, tagging, or metadata. This ensures that data is easily searchable and retrievable.
- Access to information within the repository is controlled and managed based on user roles and permissions. Security measures are implemented to protect sensitive data.
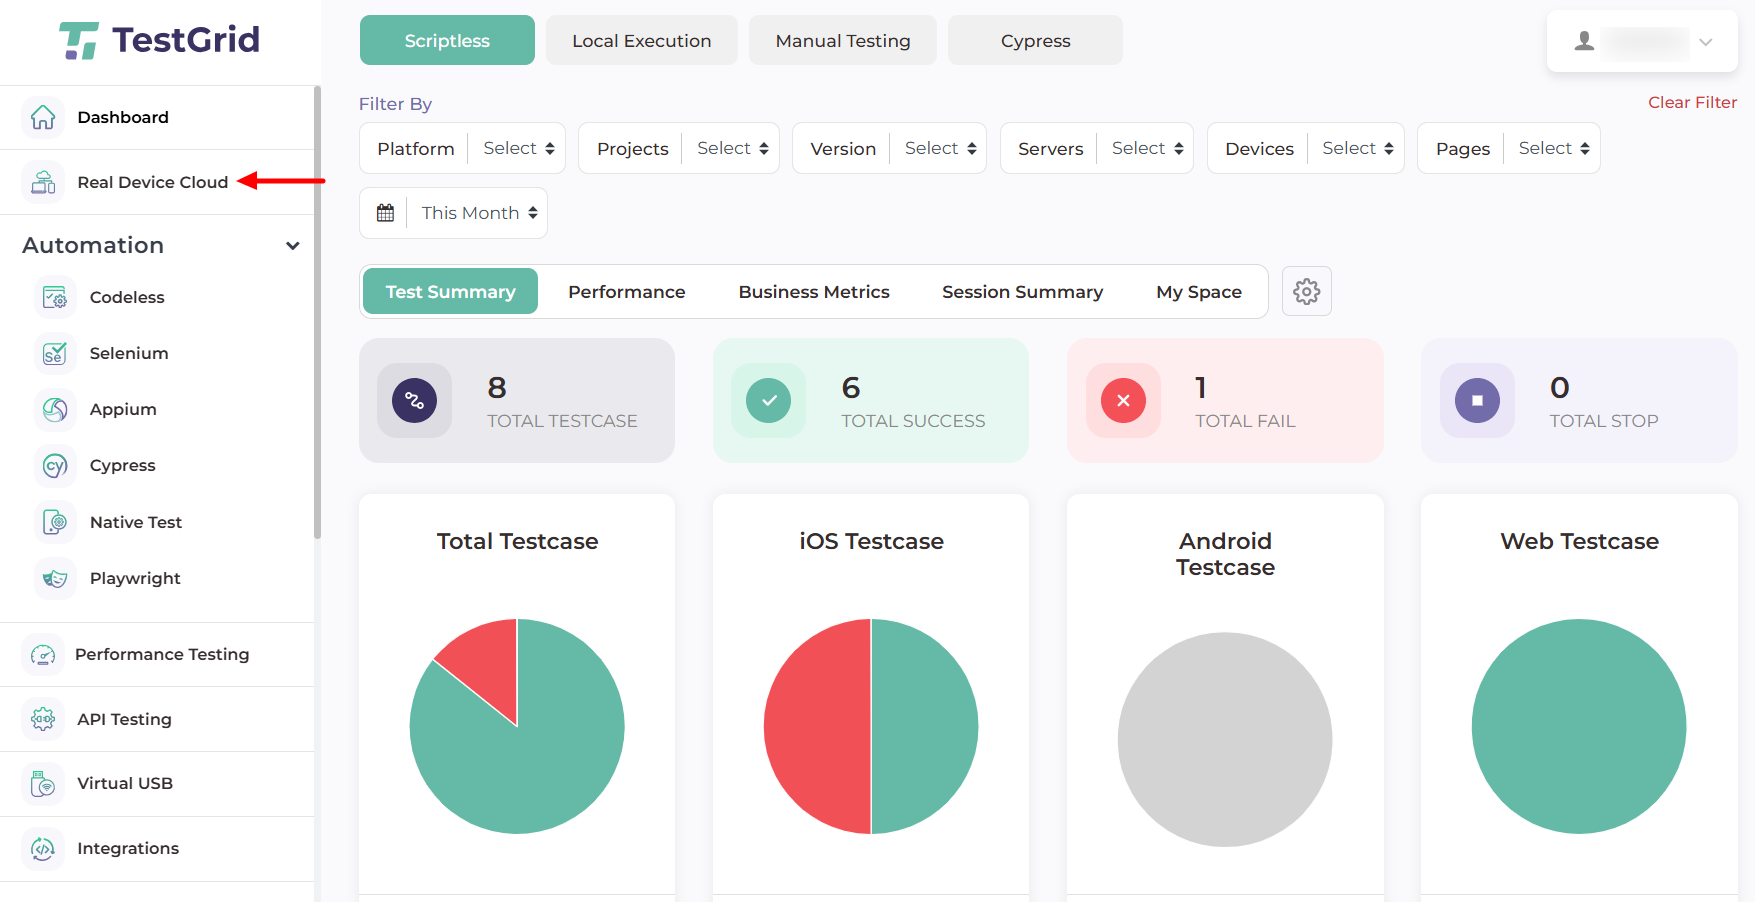
Step 1: Log in to the TestGrid Platform using valid credentials and click on Device Cloud.
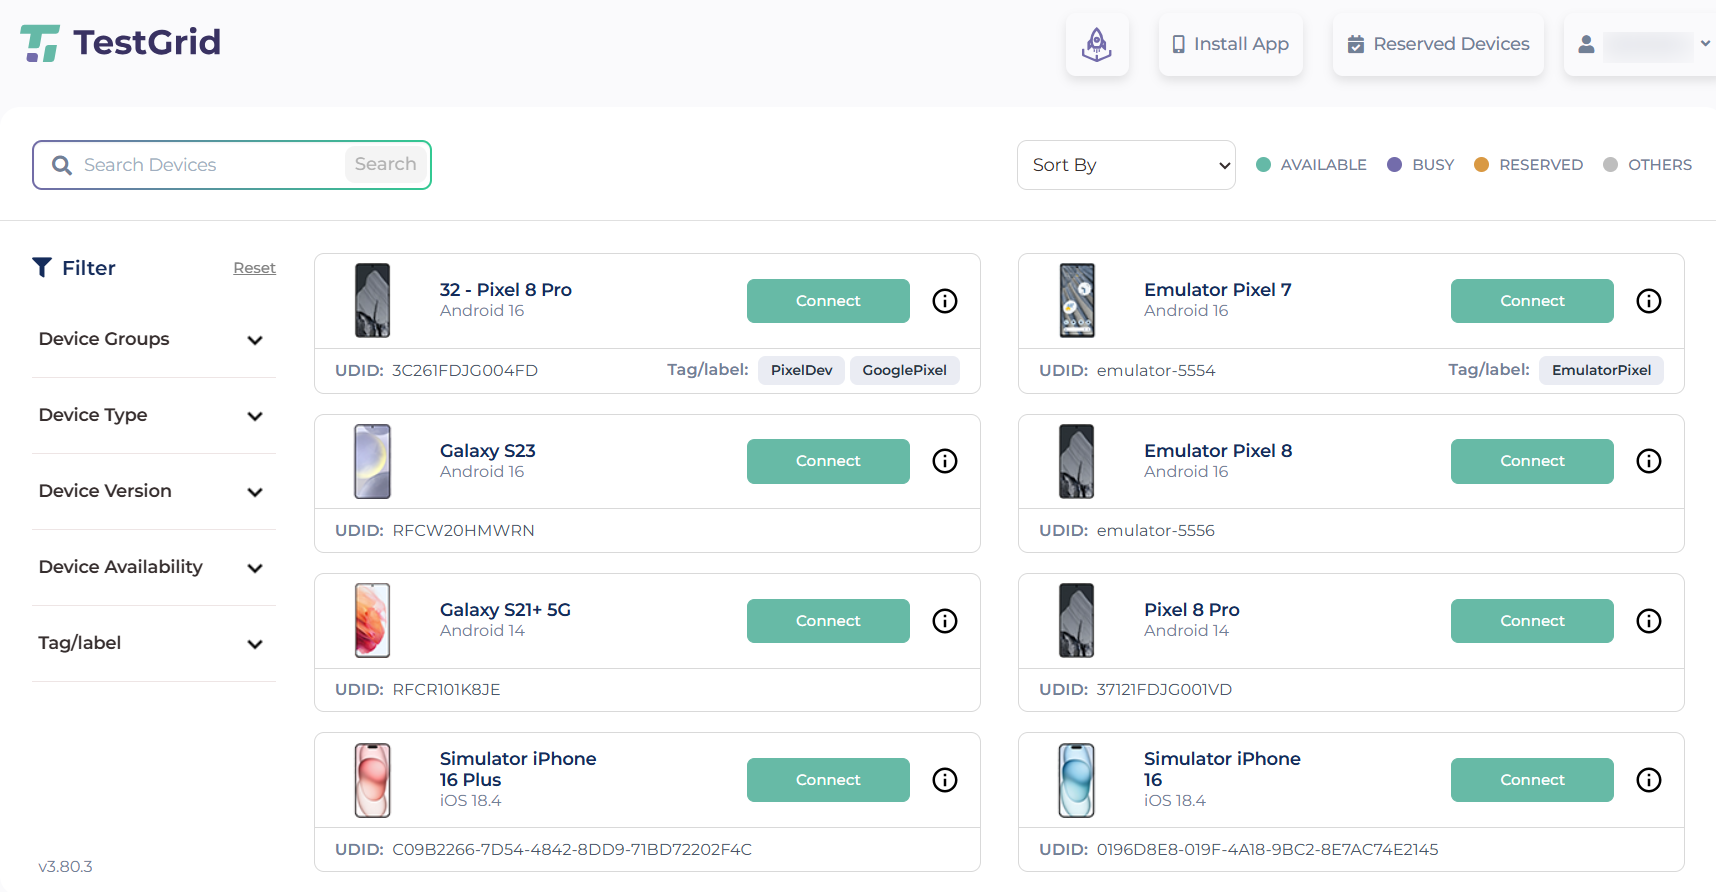
Step 2: After connecting one of the devices, you can perform testing tasks and activities. We keep track of all recording sessions in our central repository.
- The central repository is organized into three categories: Test Case Execution, Local Execution, and Manual Sessions.
- Once you connect to a device, you can start recording from the bottom corner of the screen and perform actions such as scrolling, swiping, and navigation. After completing the activity, click the Stop button. A summary screen will appear where you can fill in the required information. Finally, click End & Release to end the session and release the device.
- The Manual Session details and recordings are available on the Dashboard under the Test Results section. Select Manual Sessions, choose the relevant test case and device, and you will be able to view the recorded session in detailed video format, along with supporting information such as network logs.
Step 3: Review Local Execution Results.
- For Local Execution, you can access detailed session logs, video recordings, timestamps, and network logs for comprehensive analysis. Video recordings capture all actions performed during the test execution, and you can easily search for specific session videos for quick access.
- Each session provides options to download, save, or delete the recording as needed. The interface supports multiple devices, displaying separate video sessions for each device to improve visibility and enable easy comparison.
- On the left side of the screen, you can view detailed network logs and insights data, including CPU usage, memory consumption, and API calls, to help with deeper performance and debugging analysis.
Notes : Users can access the most recent data based on the retention policy configured by the user.